
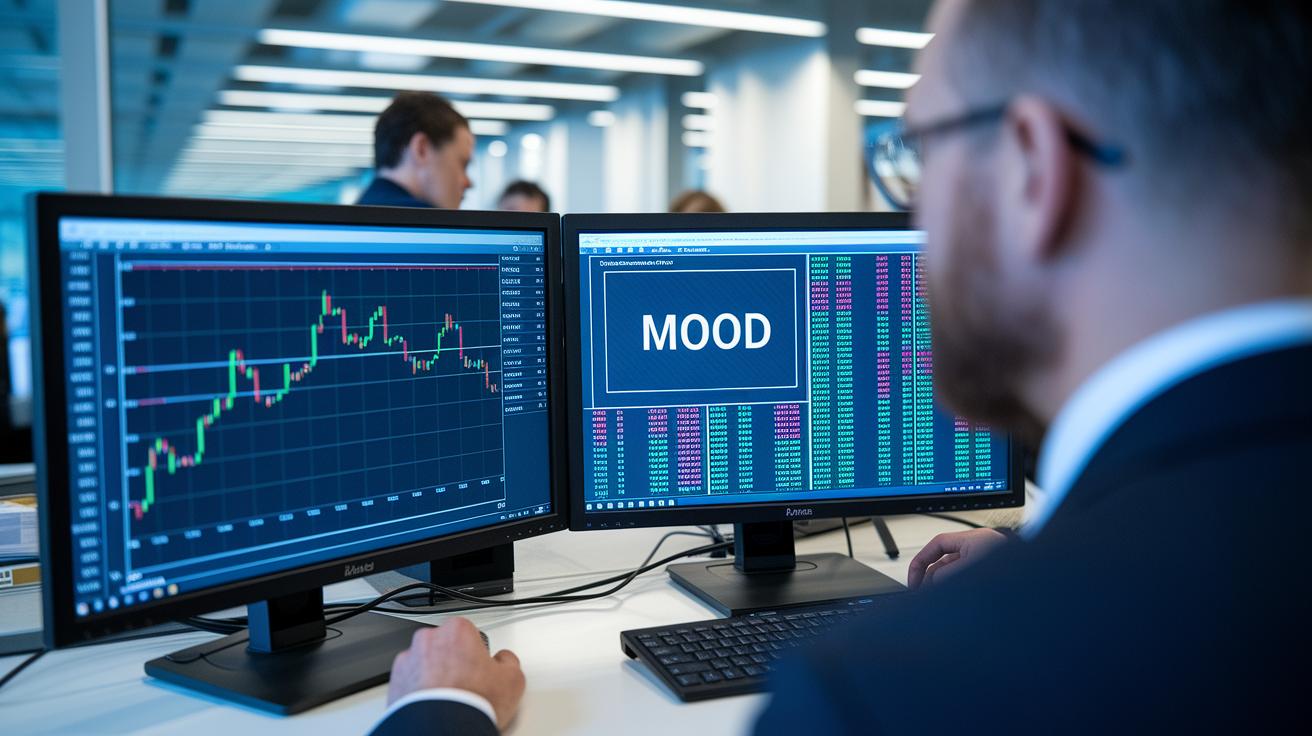
Have you ever noticed how the market can move simply because of the mood in the room? Sometimes, it’s not just about company news but about how investors really feel.
Market sentiment indicators mix together trading numbers, online chatter, and bits of economic data to give us a clear picture of the overall vibe. They can spot a shift in confidence even before the big headlines hit.
In this post, we’ll chat about these signals and see how they spark upward trends in the market. It’s a fresh way to look at market movements, almost like feeling the pulse of a busy trading floor.
market sentiment indicators Spark Bullish Trends
Market sentiment indicators mix many data points to show how investors feel. They pull numbers from trading volumes, online chatter, and economic reports to paint a picture of the overall mood. Instead of just looking at balance sheets, they capture the energy of trading psychology, often revealing emotional shifts before big news hits. For example, did you know that before she became famous, Marie Curie used to carry test tubes of radioactive material in her pockets? Wow.
Unlike basic financial numbers, these indicators also take big economic signals into account. Data such as GDP growth, interest rates, and tax-policy changes add another layer to the analysis. This method shows how the current economic mood can drive price changes, no matter what a company's earnings say. Many traders use ideas from investor psychology and behavioral economics to sense changes in confidence and adjust their strategies.
Sometimes, these indicators push price trends upward even if the company’s fundamentals aren’t strong. They act as early warnings by combining clear data with natural market reactions. With both economic mood gauges and trader psychology on your side, you gain a deeper understanding of market movements. This blend of solid facts and investor feelings can truly set off bullish trends on the trading floor.
Key Market Sentiment Indicators: Types and Calculation Methods
CBOE Volatility Index (VIX)
The VIX gives you a sneak peek into how choppy the market might be by looking at S&P 500 options. It pulls together option prices using a smart, if complex, formula that tries to predict market swings. When you see a high VIX number, it usually means traders are feeling jittery and may be getting ready for a downturn. For example, a sharp jump in the VIX can be a warning sign that big market moves are on the horizon.
52-Week High/Low Sentiment Ratio
This indicator looks at how many stocks hit their new 52-week highs compared to those that are hitting new lows. It uses everyday price data to give you a feel for how broad the market’s move really is. When most stocks are reaching new highs, it tells you that investor optimism is high. On the other hand, if more stocks are dropping to new lows, that could mean a bearish change in the air. For example, nearly all stocks riding high suggests a very bullish mood.
NYSE Bullish Percentage (NBP)
The NBP measures how many stocks on the NYSE show bullish patterns using point-and-figure charts. This technical method helps gauge the overall mood on the exchange. A higher percentage means more traders are leaning toward a positive, upward trend. As an example, when the NBP starts to rise, it usually signals that traders are expecting stocks to go up.
CNN’s Fear and Greed Index
This tool scores market emotions on a scale from 0 to 100 by considering factors like price momentum and trading volume. It pulls together different sentiment measures to see if fear or greed is driving the market. Extreme scores tell you that one emotion is dominating. For instance, if the index reads near 90, it typically means that greed is at its peak, sometimes hinting at a possible market correction soon after.
Buffett Indicator
The Buffett Indicator compares the total market value of all U.S. stocks to the country’s GDP. By using figures for market capitalization and GDP, it helps you understand if stocks are getting too expensive relative to the economy. When this ratio is high, it might mean that the market is overheated. For example, a significant climb in this indicator can suggest that market prices are out of step with economic reality.
| Indicator | Market Covered | Calculation Method |
|---|---|---|
| VIX | S&P 500 Options | Calculated from options volatility |
| 52-Week High/Low Ratio | Broad Market | Ratio of stocks reaching highs vs lows |
| NYSE Bullish Percentage | NYSE | Bullish point-and-figure chart patterns |
| Fear and Greed Index | Overall Market | Emotion score on a 0–100 scale |
| Buffett Indicator | U.S. Market | Market cap divided by GDP (then multiplied by 100) |
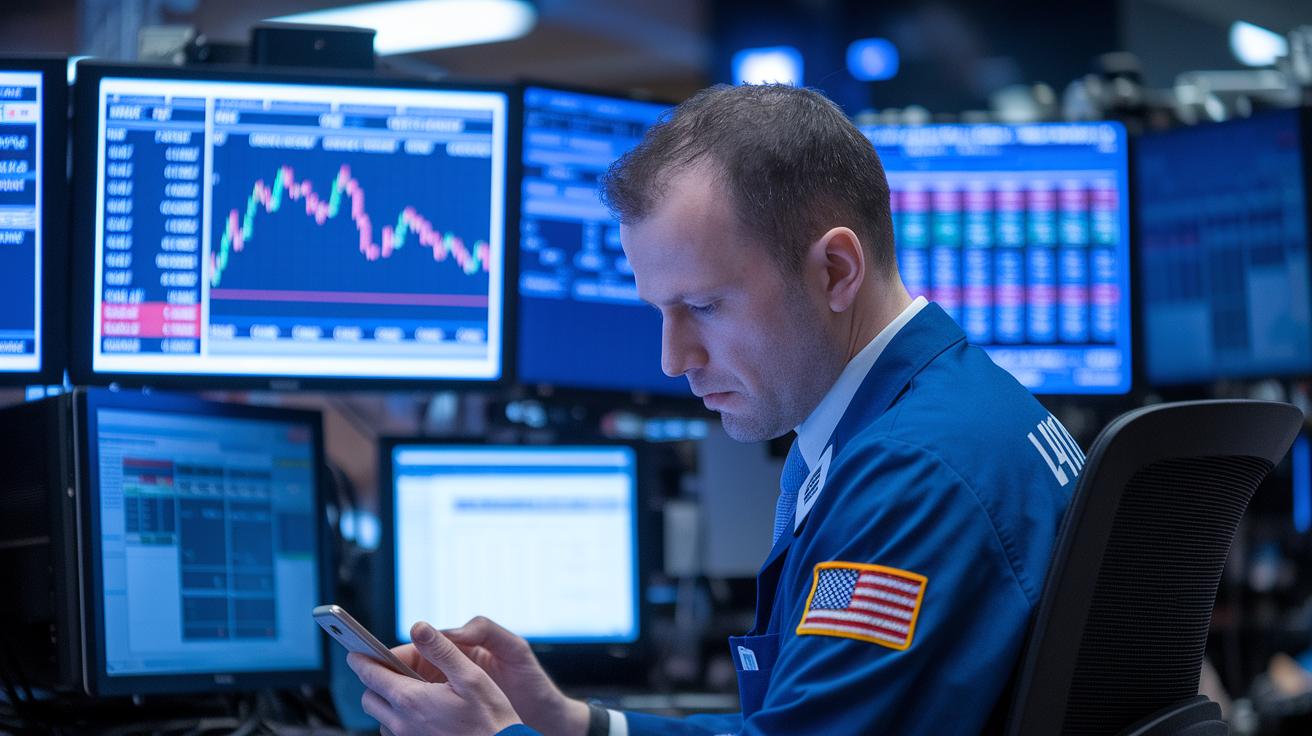
Market Sentiment Indicators in Action: Real-World Trading Examples

Traders mix hard data with gut feelings every day, and these examples show just how that works. They keep an eye on numbers, but also trust their instincts to guide their moves.
-
In March 2020, during the big sell-off, traders noticed the VIX jumping above 80. They saw it as a sign that panic might soon reverse, so many quickly placed short-term trades to take advantage of the sudden drop in prices.
-
By late 2021, the Fear and Greed Index had climbed past 90. This told traders that tech stocks were getting too hot, so several of them decided it was a good time to exit their positions, expecting a market correction.
-
During the middle of 2019, a rising 52-Week High/Low Sentiment Ratio caught traders' attention. This clear sign of overall market strength helped many investors lock in their gains while riding the upward wave of fresh highs.
-
Some day traders even started combining social-media sentiment with more traditional technical signals. This mix gave them hints to back off in riskier moments, especially when the market got really choppy and emotions ran high.
-
In early 2022, signals from a range of sentiment tools lined up just right. This coordinated hint led traders to rebalance their portfolios before a market shift hit, letting them capture gains while lowering their risk.
Each of these examples shows how blending simple signals with real-world intuition can make a big difference in trading decisions.
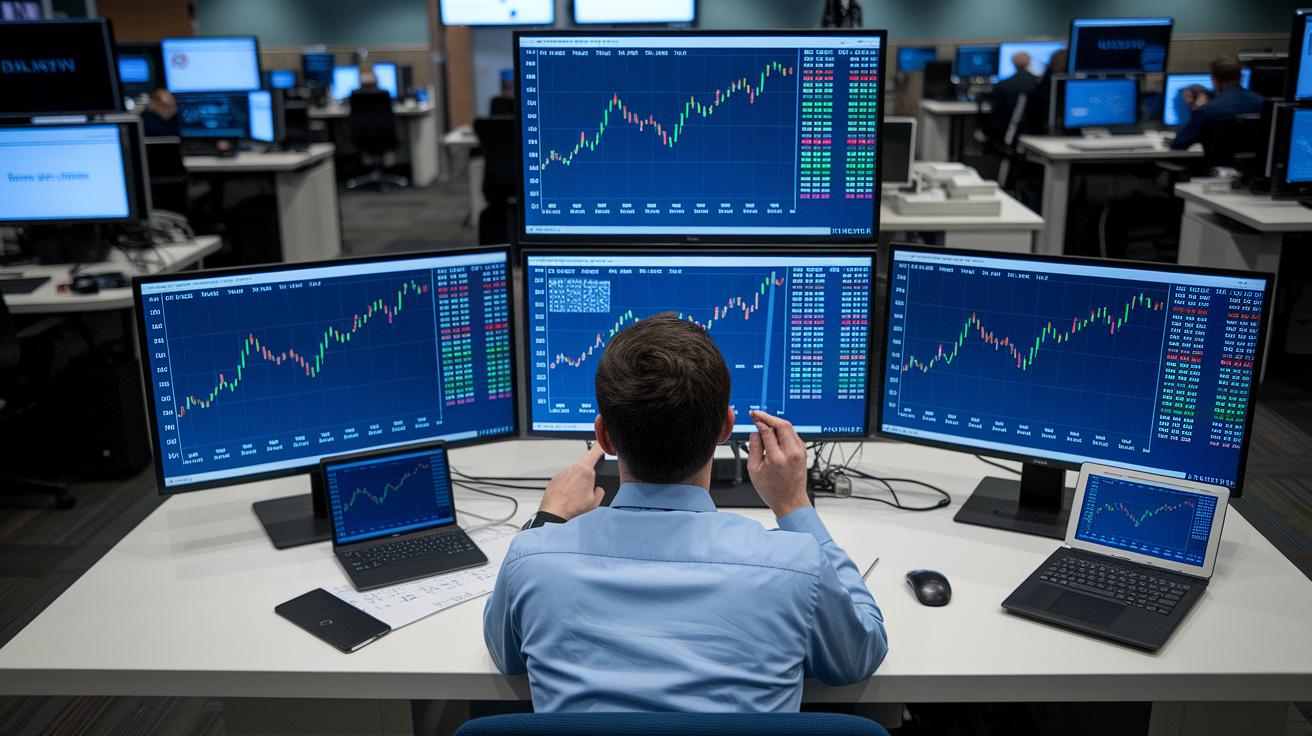
Interpreting Market Sentiment Indicators for Strategy Development
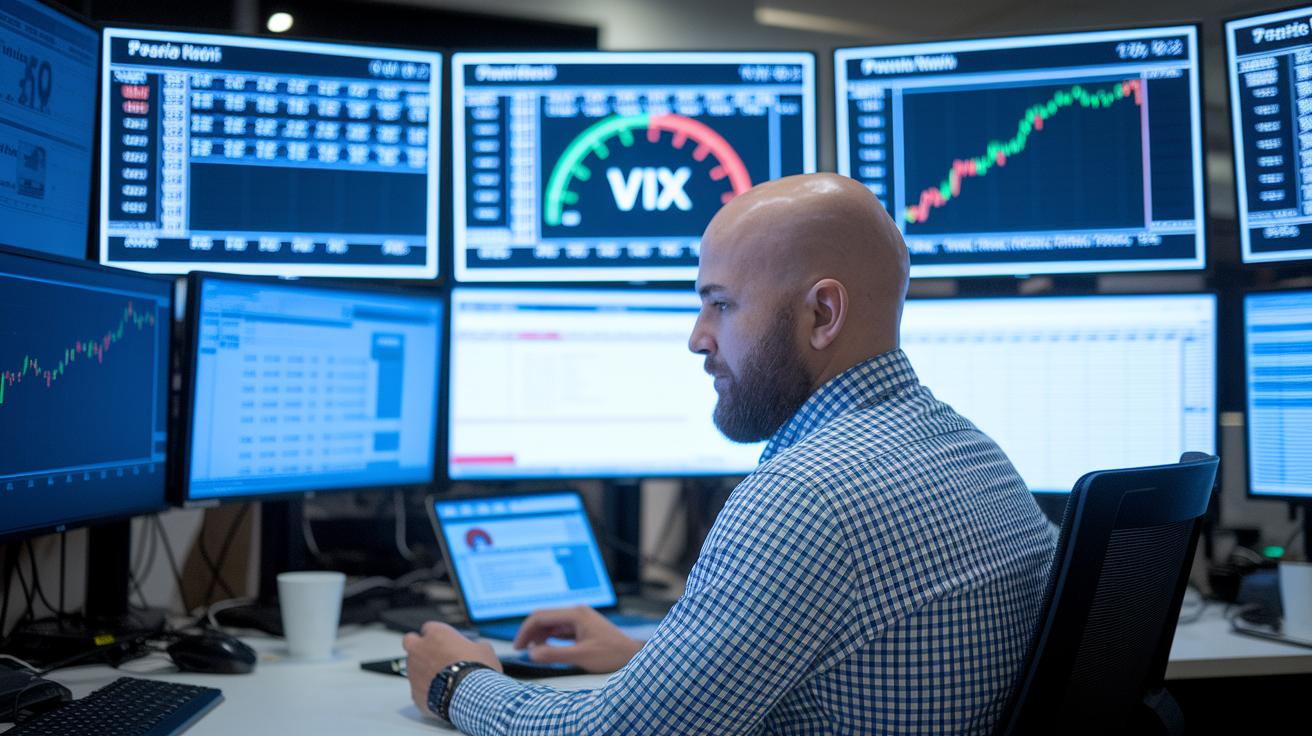
When the VIX shows values higher than 30 or lower than 12, it can hint that the trend might soon change. Traders often use these numbers to sense the overall mood of the market. If you see these extreme levels, it might be a good idea to look over your positions and get ready for a shift.
Another handy tool is the high/low sentiment ratio. When this ratio covers over 500 stocks, it can signal that things might be either overbought or oversold. This means traders might want to focus on stocks acting differently from the rest of the market, as these could hold the key to new opportunities.
Mixing hard data with your own observations can really sharpen your strategy. For example, if there’s a sudden spike in the news or a buzz on social media, it adds some extra clues that numbers alone might miss. Combining these hints with techniques like moving-average crossovers can help you decide the best times to jump in or get out. For more tips on blending sentiment with price-action cues, check out this guide on Technical Analysis Fundamentals.
Using these insights as checkpoints lets you build a clear, rule-based approach. Traders can set specific levels that tell them when to tighten stops or even exit a position completely. This clear mix of data and observation lays a solid foundation for a sentiment-based trading game plan.
Challenges and Limitations of Market Sentiment Indicators
Market mood data often comes in a bit later than the price changes happening in real time. For example, if trading volume suddenly spikes, you might not see that update right away. This means you could end up making choices based on information that is already out of date.
Sometimes, news pushed by the media can make things look more dramatic than they are. This extra noise can mix with genuine trends, so you need to filter the signals carefully to tell what really matters.
When you compare how investors feel in different countries, you also see some surprises. In one place, the mood might be very optimistic while in another, stricter rules or higher corruption can make people more cautious. It’s important to look at these readings in the local context to get a true picture of global market behavior.
Big swings in market emotion indexes can lead to unpredictable patterns. Even seasoned traders might make quick decisions based on short-term feelings rather than the overall trend. That’s why balancing these readings with longer-term trends and solid filtering is key to managing risk effectively.
Advanced Market Sentiment Indicators: Tools for Real-Time Analysis
Real-time dashboards like Semantic Visions and AIM Research mix news, social media chatter, and economic data to give you clear insights. These tools offer interactive graphs showing market mood and live charts tracking trader emotions as conditions change. Picture it like watching a dynamic screen where every flicker in the chart tells you how investors feel.
These dashboards also come with historical backtesting, which means you can compare past mood cycles, whether the market was soaring or taking a dip. Many traders say it feels like reading the heartbeat of the trading floor.
Platforms like TradingView build on this by adding features such as custom fear and greed gauges. Their market tools overlay on price charts, so you instantly see both the hard numbers and the overall sentiment. Plus, automated emotion analyzers dig through raw social and economic data to create easy-to-understand visuals, making it simple even if you’re just starting out. Some tell us, "Using TradingView's mood tools is like having an expert quietly guiding you while you trade."
Altogether, these advanced sentiment tools give every investor a real-time, comprehensive view. By combining direct feedback from investors and surveys with live data, you get a multi-angle look at market vibes that can really help when making quick decisions.
Final Words
In the action, the blog explored the role of market sentiment indicators in shaping trading moves. It unpacked how various tools like the VIX and Fear and Greed Index provide real-time views of investor mood.
The analysis included examples and strategy tips to integrate these clear signals into smarter trade choices. Everything discussed aims to help build a secure and straightforward path toward better investment decisions, sparking confidence and hope for your financial future.
FAQ
What does market sentiment today mean and can you give an example?
Market sentiment today reflects the overall mood of investors measured by tools like VIX or the Fear and Greed Index. A high VIX reading can indicate heightened concern, while low levels suggest calm confidence.
What are the best stock market sentiment indicators?
The best stock market sentiment indicators include VIX, the 52-Week High/Low Sentiment Ratio, NYSE Bullish Percentage, and CNN’s Fear and Greed Index. They offer quick insights into whether investors are leaning toward risk or caution.
Are there free market sentiment indicators available?
Some free market sentiment indicators include basic versions of the Fear and Greed Index and TradingView’s sentiment tools. They allow you to monitor overall mood without additional costs, making sentiment analysis accessible.
How does TradingView display market sentiment indicators?
TradingView displays sentiment indicators through live overlays on price charts, combining custom fear-and-greed gauges with technical patterns that let you quickly assess current market emotions.
What does the Fear and Greed Index reveal today and on TradingView?
The Fear and Greed Index reveals investor moods by rating emotions from extreme fear to extreme greed. Live readings on TradingView provide real-time signals that can guide risk evaluation and trading decisions.
What are sentiment indicators in the market?
Sentiment indicators measure the overall mood of investors by collecting data on price movements, trading volumes, and analyst opinions. They help you understand the market’s optimism or caution without relying solely on fundamentals.
How can I know the market sentiment quickly?
You can determine market sentiment quickly by watching key indicators like VIX and the Fear and Greed Index. These tools provide snapshots of investor emotions and risk appetite based on current market data.
What is considered a good market sentiment?
A good market sentiment is when key readings show balanced optimism without extreme highs or lows. This stable mood often reflects healthy investor confidence and a market with steady growth prospects.