
Have you ever wondered if a rocky market could be a sign of a bright future? Recent trends show that the crypto scene is taking a dip even as trading volumes hit their highest level this year. It seems that even when numbers fall, many investors keep a close eye on the market and stay active. Bitcoin still acts as a steady anchor, although some technical signs suggest you should be a little cautious. In this piece, we'll chat about how these market swings might open up fresh chances for everyone, from the small investors just starting out to the big players with more at stake. Let's dive in and see what these changes really mean for you.
crypto market analysis Sparks Positive Outlook
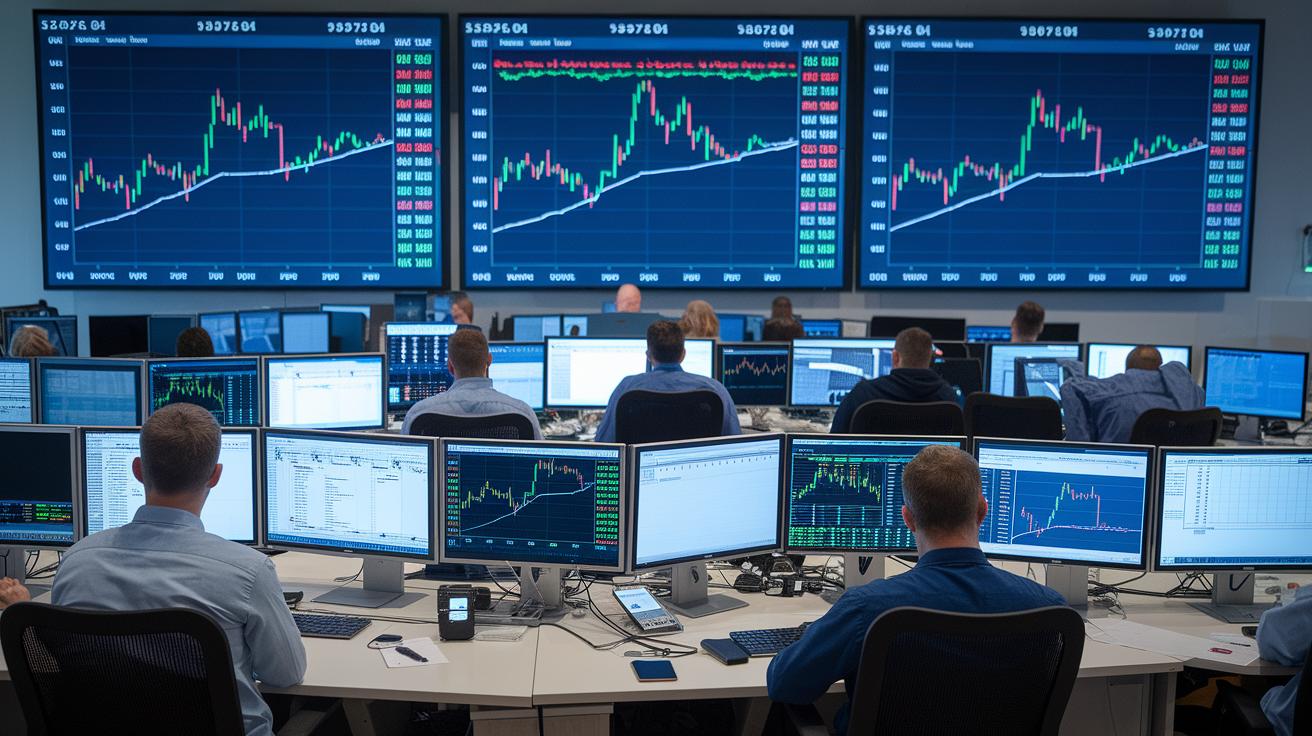
Over the past day, the crypto scene has been a mixed bag. The overall market value fell nearly 5% in one day, erasing earlier gains from September, while trading volume surged to a yearly high of $9.72 trillion. This shows that even during rough patches, traders remain very active, creating a lively space for both casual investors and big institutions.
Bitcoin, the steady force in the digital world, is helping to hold things together amid the swings. Even though it usually boosts market confidence, some technical signs suggest a note of caution. The relative strength index, which measures momentum, has slipped into less robust territory and important moving averages are close to key levels. These hints might mean there is some downward pressure, even as Bitcoin continues to support the broader landscape.
Experts are divided on what might happen next. Some believe that if Bitcoin drops below $107K, it could be a great buying chance, while others think hitting $112K might kick off a rally, especially for altcoins. They’re also keeping an eye on Bitcoin’s dominance and the performance of the top five coins. Together, these insights form a picture of a market that is a bit shaky right now but still holds promise for those who watch carefully.
Technical Indicator Review in Crypto Market Analysis
Chart-based tools help you see the market in a simple, clear way. They turn tricky price movements into visual hints so traders can feel the market’s pulse and know when to act.
- RSI: This tool looks at average gains and losses over a set time. You’ll usually find it near the top of the chart. If the RSI drops below 50, it suggests the market might be losing steam and could head lower.
- Moving Averages: These lines show an average of past prices directly on the chart. When a short-term average crosses above a long-term one, known as a golden cross, it often hints that the market might turn bullish.
- Support/Resistance Levels: These lines mark price points where the market has reversed before. If prices break above resistance, it can mean bullish strength. Conversely, falling below support might mean bearish pressure.
- Fibonacci Retracement: Using key ratios from the Fibonacci sequence (a math series that helps predict patterns), this tool marks levels on a chart after big price moves. These levels can show where prices might reverse, helping you decide when to buy or exit.
- MACD: Standing for Moving Average Convergence Divergence, this tool measures the gap between short-term and long-term averages. A bullish sign pops up when its line crosses above the signal line.
Putting these tools together gives a sharper picture of the market. For instance, if the RSI falls below 50 while the price stays near key moving averages, it could warn of a slowdown. On the other hand, a golden cross paired with a bullish MACD crossover might be the perfect moment to buy. Combining support and resistance with Fibonacci levels gives extra clues about where a reversal could happen. This mix creates a solid plan, turning raw data into clear, smart trading moves.
Learn more about technical analysis indicators here: https://tradewiselly.com?p=1595
On-Chain Data Insights for Crypto Market Analysis

When you dive into on-chain analysis, you're looking right at the data stored on a cryptocurrency’s public ledger, kind of like checking a live activity feed. You get to see things like miners cashing out, hedge funds pulling back, and coins moving in and out of exchanges. It’s like having a clear window into blockchain activity.
Another neat thing is that it tracks key numbers such as how many active addresses there are, the volume of transactions, the fees on the network, and big wallet moves. These numbers work like signals, showing you where coins are headed and how often trades are happening. By observing them, you can connect the dots between market activity and the mood or sentiment behind the price changes.
Recently, on-chain data has been sharing a pretty detailed snapshot of today’s market vibe. It seems that miners are selling off their assets a bit more, which might mean they’re ready to take profits. At the same time, top holders are gathering coins slower, hinting at a cautious approach amid increased bearish chatter online. Keeping an eye on these trends gives you a real sense of the market’s confidence, or lack thereof, and can be a big help when you're planning your next move.
Fundamental Analysis in Crypto Market Analysis

Fundamental analysis is our way of figuring out what a cryptocurrency is really worth. We mix hard facts, like market cap, trading volume, and how many users a network has, with easier-to-see details, such as project plans, partnerships, and the team behind it. This approach gives investors a fuller picture of a coin's potential rather than just its current price.
Quantitative Metrics
Numbers like market cap, trading volume, and network growth are key parts of the picture. These figures let us see how much people use a coin and how much trust it has among users. When we notice high trading volumes or steady network growth, it often means that the market is getting stronger and the coin might stick around for the long haul.
Qualitative Drivers
There are also important non-number parts, like project updates, big money moves, or changes in rules and regulations. For example, a recent investment of $4 million in USD.AI right after its IPO shows that big players are taking notice. And when new services, such as 24/7 blockchain cross-border payment options, launch, they add real value. Even shifts in government rules, like those discussed in this article (https://tradewiselly.com?p=1586), can influence how investors feel and impact long-term trends.
All these pieces of information come together to form detailed coin valuation reports that both new and experienced traders can use. These reports help everyone understand how a coin might handle market ups and downs and show its future growth opportunities, leading to smarter and more secure investment choices.
Seasonal and Behavioral Trends in Crypto Market Analysis
Every September, the crypto market follows a pattern that many investors have noticed. In eight out of the last 11 years, returns have taken a hit during this month. This trend is driven by big money moves like portfolio rebalancing, fiscal-year adjustments, post-summer tax planning, and cash drains. Bitcoin plays a big role too; its performance often sets the tone for altcoin cycles, making the market quite unpredictable around this time.
By the end of the month, investors get more cautious. Fear, uncertainty, and doubt seem to rise, and margin trading drops noticeably. This change gives us a clear sign that the market mood becomes a bit more hesitant.
Traders are adapting to these shifts by tweaking their risk management strategies. Many now set tighter stop-loss orders and reduce their exposure to volatile positions. They also take a close look at short-term risks and rebalance their portfolios to keep things more stable. These careful moves help them handle the bigger price swings and unique market dynamics that show up in September.
Forecasting Price Trends and Emerging Developments in Crypto Market Analysis

We use smart forecasting methods that rely on algorithmic models to turn past price data into clues about the future. Tools like ARIMA and machine learning sift through previous trends and market moves, offering traders a clear, data-driven snapshot to guide choices in this fast-moving crypto arena.
Algorithmic Model Insights
ARIMA models look at past price patterns, cutting through the noise to show what really matters. And machine learning tools keep learning as fresh data comes in, tweaking predictions along the way. Together, they create a system that is both steady and adaptable enough for the energetic crypto market.
Expert Trend Projections
Analyst forecasts add a human touch to market trends. Some experts see Bitcoin dipping below $107K as a good chance to buy, while others think a rise toward $112K could kick off altcoin rallies. This blend of number crunching and expert insight paints a clearer picture for anyone keeping an eye on the market.
Recent news and trends are also shifting the forecasts. We’re seeing developments like AI-powered trading bots, growing multi-asset indices, and new ways to mix decentralized finance liquidity protocols into the mix. Big moves, like a $4 million investment in AI and the launch of round-the-clock blockchain payment solutions, are changing the game. Early-stage altcoin picks backed by strong on-chain and technical signals are boosting confidence in future performance. All these insights together create a roadmap for smart, actionable strategies. For more ways to blend these signals into effective moves, explore crypto investing strategies.
Tools and Platforms for Crypto Market Analysis

Choosing the right tool for tracking crypto markets is key to staying on top of fast-changing trends. A good platform gives you live data through easy-to-read dashboards and combines order details, blockchain updates, and even public mood checks so you can see the full picture. When you trust well-known crypto investment sites like the ones at gotocryptos.com, you get helpful features like custom alerts, multi-asset tracking, and integrated news updates.
| Platform | Key Feature | Pricing Model |
|---|---|---|
| TradingView | Advanced charting and custom alerts | Free/Paid subscription |
| CoinMarketCap | Live market comparisons and news adds | Free/Paid options |
| Glassnode | Deep blockchain analysis and mood metrics | Subscription-based |
| CryptoQuant | All-round exchange flow data and asset tracking | Free trial/Paid subscription |
Mobile apps are a great way to keep connected with market shifts while on the move. Many of these platforms come with strong mobile versions so you can check your trades, set up alerts, and watch key hints anytime, anywhere.
Final Words
In the action, we explored a clear snapshot of today’s crypto market analysis, from recent market moves and technical signals to on-chain insights and seasonal trends. We broke down price forecasting methods and highlighted essential tools that help investors keep pace with dynamic shifts. Our discussion made complex data feel approachable, giving you a straightforward guide to smarter crypto decisions. Keep your focus sharp and your strategies positive, there’s plenty to look forward to in this vibrant market.
FAQ
What does the crypto market analysis chart show?
The crypto market analysis chart shows live trading data, including price changes, volume, and trends that help you see current market movements quickly.
What is the best crypto market analysis?
The best crypto market analysis combines live data, technical signals, on-chain metrics, and news insights to give a clear view of market conditions for both new and experienced investors.
What does the cryptocurrency market today look like and how is it doing currently?
The cryptocurrency market today displays noticeable volatility and strong trading volume, with technical signals and support levels guiding market activity and investor sentiment.
Why is the cryptocurrency market down today?
The cryptocurrency market is down today due to recent 24-hour losses, weaker technical indicators, and increased sell-offs which reflect broader investor caution.
What do cryptocurrency prices live updates mean?
Cryptocurrency prices live updates mean you get real-time figures from major trading platforms, allowing you to monitor and react to rapid price changes instantly.
What is crypto news providing?
Crypto news provides up-to-the-minute reports on market shifts, technical signals, and regulatory changes to help you stay informed and make timely decisions.
What do crypto market cap and coin market cap refer to?
Crypto market cap and coin market cap refer to the total value of all digital coins, calculated using live prices and supply data to show overall market strength.
How can you analyse the crypto market?
To analyse the crypto market, you study technical charts, on-chain data, and current news events to build a complete picture of trends and potential investment opportunities.
What is the 1% rule in crypto?
The 1% rule in crypto means you invest just 1% of your portfolio in a single asset, helping limit risk while spreading investments across different digital currencies.
Is the crypto market expected to rise?
The crypto market is expected to rise as technical indicators point toward potential rebounds, though shifts in investor sentiment and regulations can affect future trends.
What does Gecko Labs offer?
Gecko Labs offers innovative tools and resources for crypto research, providing market insights and data analysis to support smarter digital asset decisions.
What is TradingView used for?
TradingView is used for real-time charting and technical analysis, offering interactive tools and community insights that help you track market trends effectively.
What features does Binance provide?
Binance provides a wide range of trading options, real-time charts, and deep liquidity, making it a popular platform for buying, selling, and trading cryptocurrencies.
What makes Coinbase a trusted platform?
Coinbase is trusted for its easy interface, strong security, and transparent pricing, which makes it a favorite among newcomers and experienced traders alike.
What type of information does Cointelegraph deliver?
Cointelegraph delivers up-to-date reports on crypto trends, market updates, and regulatory news, offering clear insights to help guide your investment choices.
What does Coinmarketcap track?
Coinmarketcap tracks market capitalization, trading volume, and price trends, providing essential data that helps you assess the overall health of the crypto market.