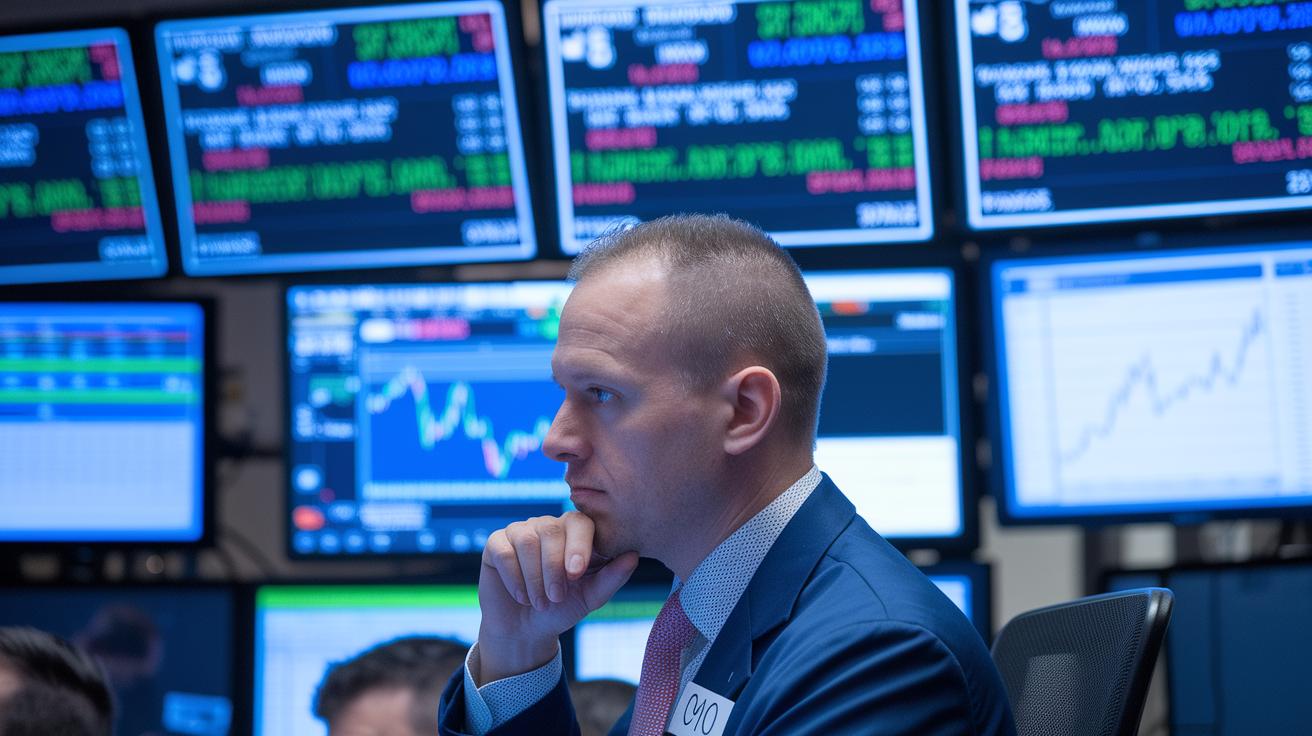
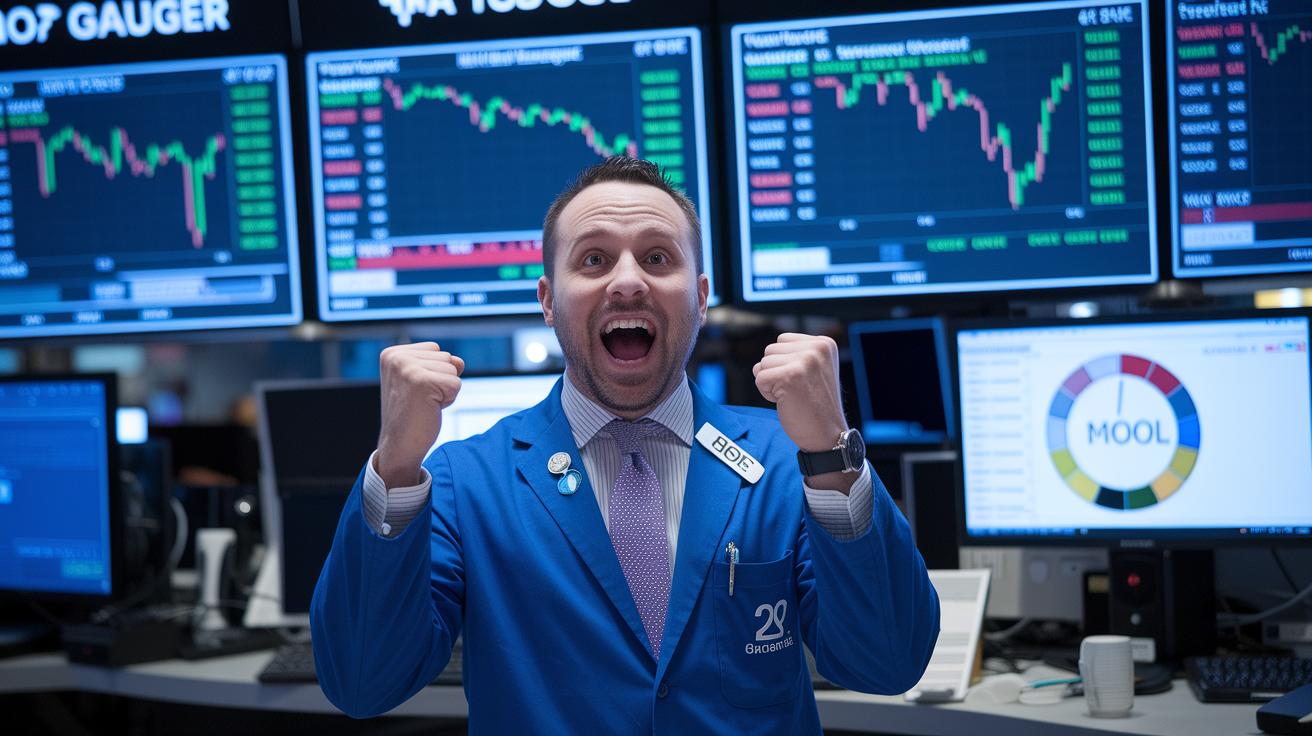
Have you ever seen how a group's mood can change the whole scene? Market sentiment is like a mood ring that shows us what investors might be feeling about future price moves. It's not just about charts and numbers but also the emotions that can trigger big trades. One trader once went from excitement to fear in a flash, showing how quickly feelings can turn the market around. Today, we'll explore what market sentiment means and how tuning into these vibes can help you make smarter money moves.
Market Sentiment Defined: Understanding Investor Mood and Market Psychology

Market sentiment is like a giant mood ring for investors, showing what everyone is feeling about the future of prices. It tells us if traders are riding high with hope or dragging their feet in doubt. Basically, it’s the vibe that guides people when they decide to buy or sell.
Before jumping into trading, one young investor made big moves just because the excitement was contagious. But soon enough, that thrill turned into fear, flipping his outlook in a heartbeat. This story reminds us how quickly feelings can change the direction of the market.
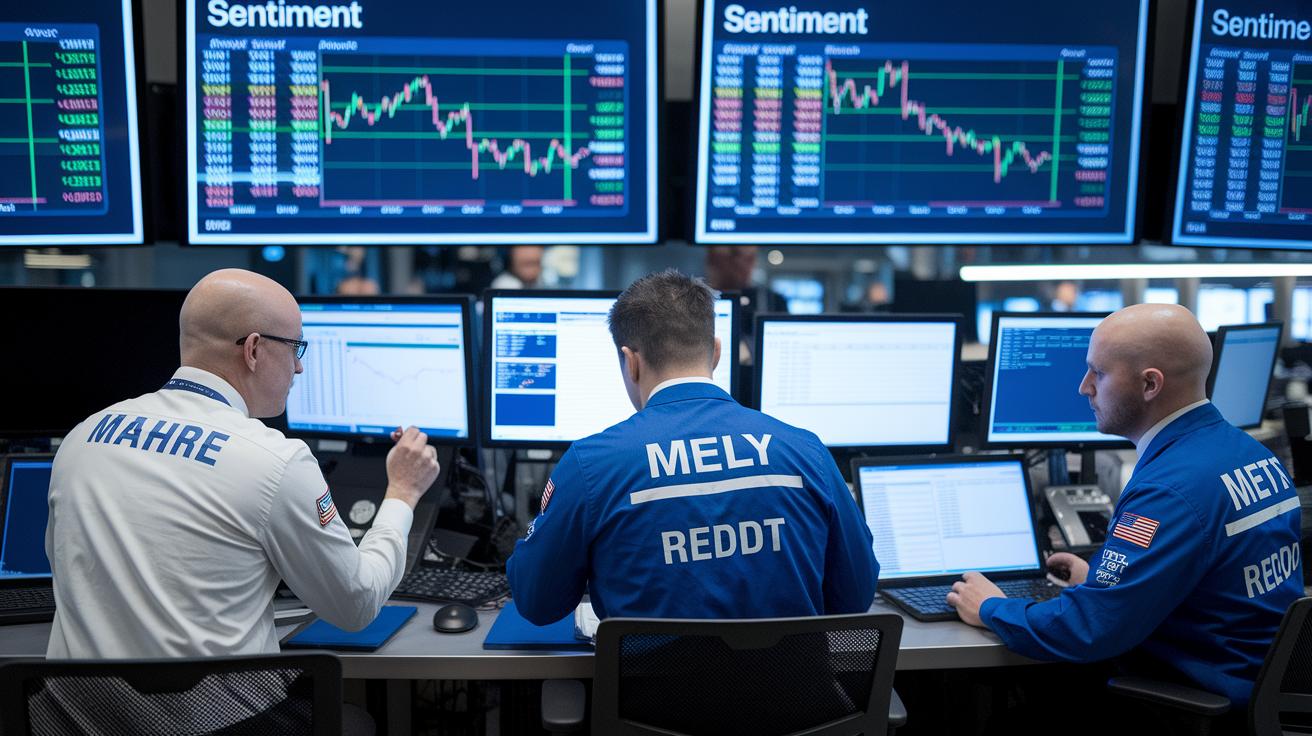
Investors and experts use market sentiment to look past just numbers and charts. They check out surveys, trading volumes, and different mood indicators to understand how people are really feeling. While technical analysis shows the data, market sentiment shines a light on the emotions behind it all. This insight is super helpful, whether the market is booming or taking a tough turn.
Measuring Market Sentiment: Key Indicators and Methods
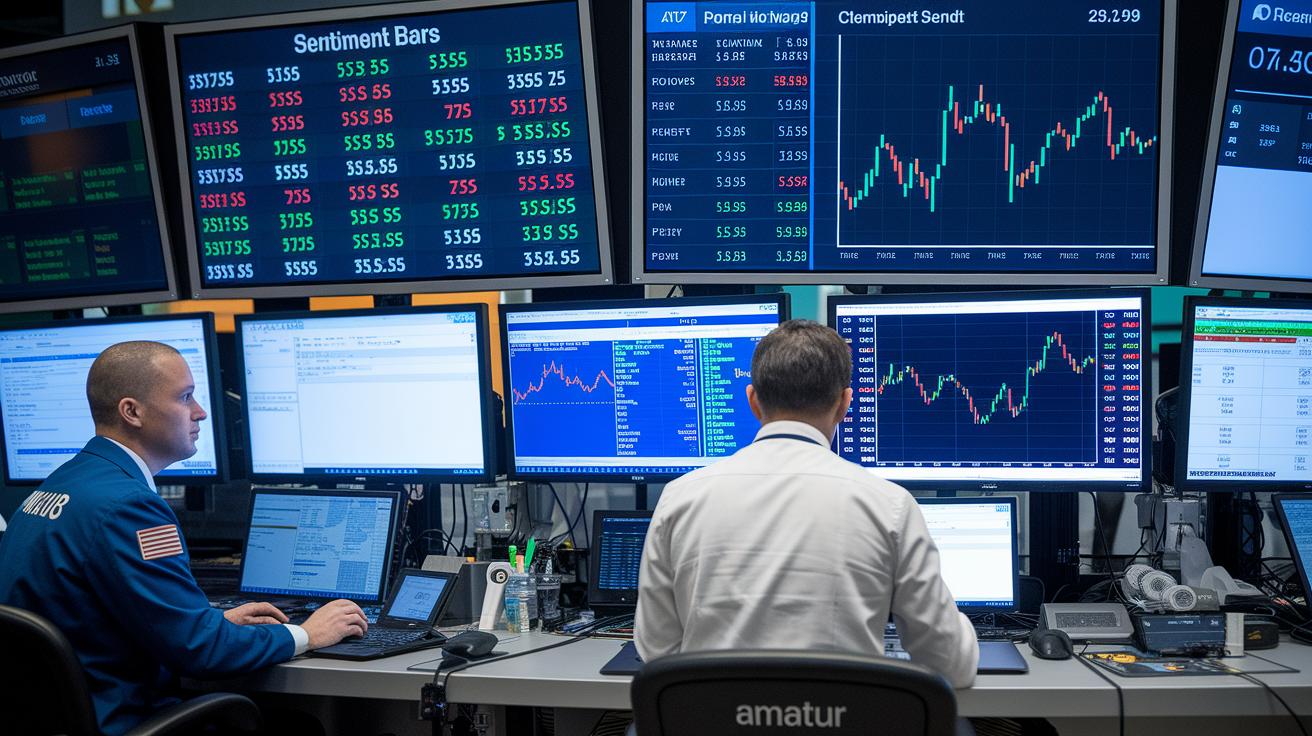
Many traders rely on a few simple yet effective tools to grasp the market's mood. One of the most popular is the VIX index. Think of it like a mood ring, it measures how jittery or calm investors are by tracking expected ups and downs in the market.
Another way to sense the mood is by keeping an eye on commodity prices. When prices for things like metals or energy change quickly, it often hints at shifts in investor appetite. For example, if oil prices take a sudden dive, it might be a nudge for traders to check their risk positions without delay.
The weekly Commitment of Traders report also gives a clear snapshot of market positions. It shows the balance between long and short bets, offering insight into how big players are positioning themselves, even if the information comes with a small delay. Along with this, futures market numbers like open interest and long/short ratios can tell you whether rising positions support an upward trend or warn of a possible drop.
Volume is another key clue. Changes in trading volume can signal shifts in market interest, making it easier to spot when the market's feeling might be changing. For those interested in diving deeper, there are solid guides on how to use volume shifts in your strategy.
Lastly, proprietary tools like order books and position ratios offer real-time views on market sentiment. Each tool adds another layer to the overall picture, helping traders decide if the market feels more bullish or bearish today.
Sentiment Across Markets: Stocks, Forex, and Crypto

In the stock market, we often check the pulse using tools like the VIX and simple surveys to gauge investor feelings. When the VIX jumps, it means traders are feeling a bit nervous; when it stays low, the mood is calm. It’s just like checking a heartbeat – a rising rate hints that change might be on the horizon. Maybe you’d say, "Hey, the VIX climbed today, showing a shift in investor nerves."
In forex trading, we lean on figures from the Commitment of Traders reports along with open interest ratios. These numbers show how traders are leaning, balancing long bets against short ones. This data can give us clues about what trend might be coming next. You might hear someone note, "When open interest goes up, it often signals a strong move ahead."
In the crypto space, sentiment is judged a bit differently. Traders use the Fear & Greed Index, which mixes data from trading volumes and social media buzz. This handy tool tells you whether investors are riding high on excitement or holding back with caution. Also, while crypto data gets updated daily, the numbers for forex and stocks usually come in on a weekly cycle.
| Market | Key Indicator |
|---|---|
| Stocks | VIX and Surveys |
| Forex | COT Reports and Open Interest |
| Crypto | Fear & Greed Index |
Each of these tools shines a light on the unique moods that drive their markets. They remind us that every market beats to its own rhythm, so staying tuned to the right signals can make all the difference.
Market Sentiment in Action: Real-World Examples and Case Studies
Imagine a deal that mixes rewards with market vibes. For example, SoFi once ran a special offer from 9/15/25 to 9/30/25. A trader who added just $50 to their account within 45 days had a tiny 0.026% chance to win up to $3,000 in stock. Even though the chance was small, it nudged many to feel more upbeat and ready to invest.
Looking back at old data, you see a clear pattern. When traders get super excited and prices soar, a drop might be right around the corner. Some say, “When everyone is cheering and prices shoot up, it might be time to be careful.” And sometimes, when the mood is very gloomy, it might actually be the best time to buy because prices can drop so much that stocks become a bargain.
Researchers have found that these highs and lows in feelings usually line up with how prices move. These real-world examples remind traders to think about market moods when they plan their next moves.
Impact of Market Sentiment on Strategies and Risk Management
Traders and portfolio managers mix market mood with both technical details and basic facts about a company. They notice that a burst of positive energy can push prices up, sometimes to levels that feel a bit too high. On the other hand, a wave of negative mood might speed up a drop. This balance of upbeat hope and healthy caution is what many use to decide when to trade. When things seem overbought, some traders start cashing in profits. And when the market feels oversold, it might be a good time to jump in, offering a better risk-adjusted chance to buy.
Many investors count on a few handy tools to check the market’s vibe. For example, one tool might suggest cutting back on a position if it looks like everyone’s overly excited. Another tool, risk sentiment analysis, is super helpful for setting stop-loss orders and picking the right size for each trade when things get bumpy.
Traders use these insights to shape their tactics:
- Tracking market trend sentiment to catch shifts in investor appetite
- Using trader sentiment insights to time entries and exits
- Monitoring market sentiment and volatility to fine-tune stop-loss moves
By weaving in these practices, trading strategies become more balanced. Each indicator offers a bit more depth so that one big mood swing doesn’t throw the whole portfolio off. This full picture helps link the market’s emotional pulse with clear, numerical data, ultimately leading to smarter risk management and more confident decisions.
Best Practices for Applying Market Sentiment in Analysis
Traders, if you want to use market mood without missing a beat, you’ve got to mix up your signals. Don’t rely on just one tool. Instead, check multiple indicators, like pairing a sentiment survey with price trends, to get a fuller picture of how the market is feeling and where it might be headed.
It’s a good idea to compare these signals with the basics of the market too. When the mood and traditional analysis match up, it’s a stronger sign to make a move. But if you notice that everyone’s feeling super optimistic or overly cautious while the price trends don’t match, that could be an early hint that the market might reverse. I remember one trader saying, "When sentiment is too hyped while price action stalls, it might be time to cut back on risk." That kind of real talk can really help remind you to stay on your toes.
Here are some simple tips to keep things balanced:
- Use several sentiment tools to build a well-rounded view.
- Check real-time monitors often for fresh data.
- Look out for mismatches between price trends and deeper sentiment readings.
By mixing sentiment data with price movements and basic market analysis, you build a strong framework that doesn’t rely too much on one signal. This approach smooths out the bumps and keeps your strategy flexible, no matter how quickly the market changes.
Final Words
in the action, we took a close look at what is market sentiment, breaking down investor mood and market psychology. We examined key tools like the VIX, COT reports, and crypto measures that capture bullish and bearish feelings.
We also saw how these signals guide trade strategies and risk management. Each piece of insight helps make investment choices clearer and more secure. Keep moving forward with confidence and a keen eye on market sentiment.
FAQ
Q: What is market sentiment?
A: The term market sentiment means how investors collectively feel about future price moves. It reflects whether traders are optimistic (bullish) or pessimistic (bearish).
Q: What does market sentiment in the stock market indicate?
A: Market sentiment in the stock market indicates the prevailing mood among investors. It often shows through price movements, trading volumes, and indicators like the VIX, signaling fear or optimism.
Q: What is an example of market sentiment?
A: An example of market sentiment is when rising prices coincide with investor optimism, showing bullish behavior, while falling prices amid worry point to bearish sentiment.
Q: Is there a market sentiment formula?
A: The concept does not use a single formula. Traders combine multiple indicators—such as the VIX, trading volumes, and long/short ratios—to gauge the overall market mood.
Q: How do you identify and analyze market sentiment?
A: Identifying market sentiment involves reviewing data like survey responses, price trends, and technical indicators. This analysis helps reveal whether emotions are driving market trends.
Q: How can market sentiment be used in forex trading?
A: In forex trading, market sentiment guides decisions by using data such as open interest figures and Commitment of Traders reports. This helps traders assess currency strength and shift strategies when needed.
Q: How accurate is market sentiment analysis?
A: Market sentiment analysis offers useful insights, though its accuracy can vary. Traders typically back up sentiment data with technical and fundamental checks for better clarity.
Q: What does a market sentiment indicator on TradingView mean?
A: A market sentiment indicator on TradingView means using built-in chart tools that display long/short ratios or similar measures, helping traders quickly see whether the prevailing mood is bullish or bearish.