
Have you ever seen how a small drop in interest rates can push businesses to spend more money? It’s like a tiny nudge that grows into a powerful push, sparking big moves in how companies invest.
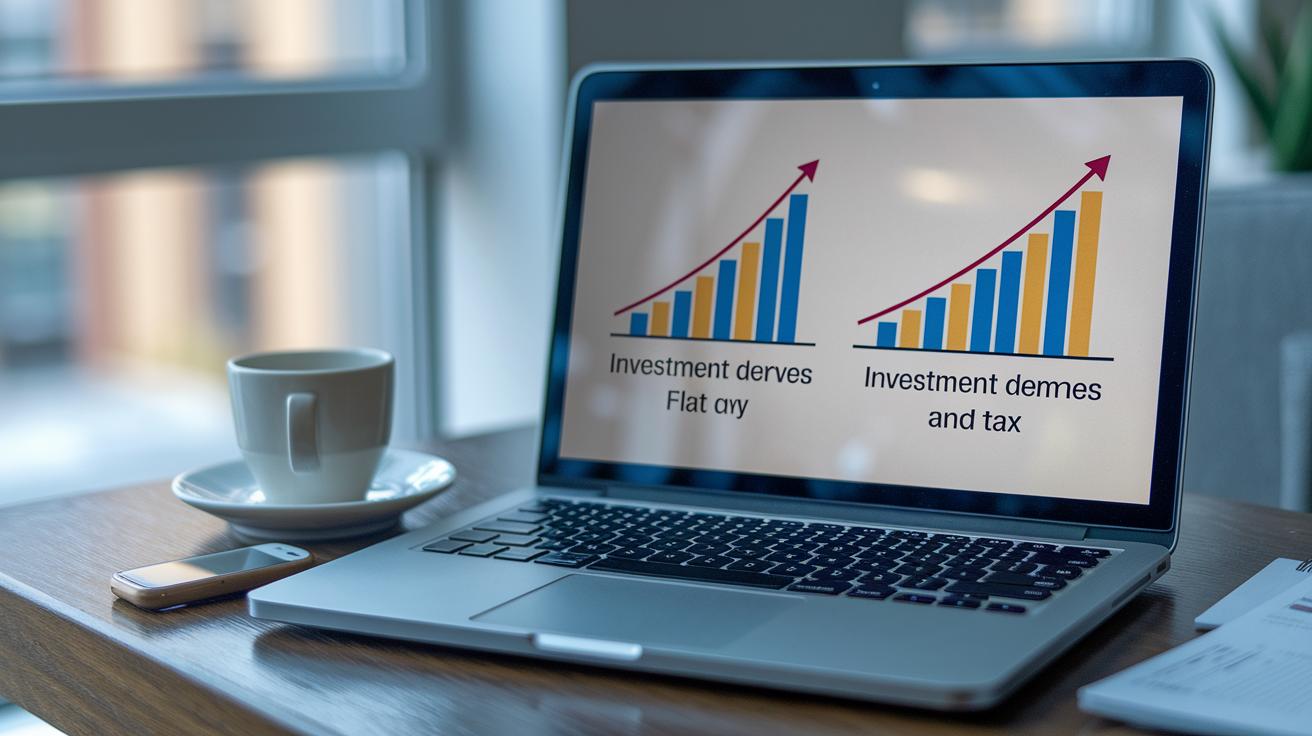
This simple graph breaks everything down. It shows steady investments, changing spending habits, and how even a little rate change can shift the whole scene. It’s a clear look at the sparks that light up our economy.
Investment Demand Graph Sparks Economic Optimism

The investment demand graph lays things out simply. On the vertical axis, you’ll see the interest rate, and on the horizontal axis, investment spending. It uses the formula I = I-bar – b multiplied by r. In plain terms, I-bar is the part of investment that stays the same no matter what the interest rate does. Meanwhile, b shows how much investment spending will change if the interest rate shifts.
Imagine a small drop in the interest rate that sparks a big jump in capital spending. It’s like seeing a tiny nudge and then watching a business ramp up spending quickly. This visual really shows how lower borrowing costs can drive more spending, which in turn brightens up the whole economy.
The curve usually slopes downward because lower rates mean lower borrowing costs. That makes borrowing a more attractive option, so businesses are more likely to invest in new things. If b is large, even a small change in the rate can lead to a big increase in spending, giving the graph a flatter look. On the other hand, if b is on the smaller side, spending doesn’t change as much, which makes the curve steeper. Other factors like expected returns, business confidence, new technology, and changes in policy can also shift the curve one way or the other.
- Interest rate on the vertical axis
- Investment quantity on the horizontal axis
- Downward slope shows lower borrowing costs boost spending
- I-bar represents constant investment spending
- Sensitivity coefficient b measures how much spending changes with rate shifts
Axes and Key Variables in the Investment Demand Graph

The graph lays out the basics by showing investment spending along the horizontal line and the nominal interest rate on the vertical line. It connects with the well-known IS curve, making it easier to see how capital is being used.
Y-Axis: Interest Rate
This vertical line tells you the cost of borrowing money. It also reflects how actions by institutions like central banks change those costs. Fun fact: even a tiny drop in rates can spark a big jump in borrowing, just like a small spark lighting up a whole room.
X-Axis: Investment Spending
This horizontal line tracks the actual money spent on things such as equipment and buildings. As borrowing costs change, investment spending does too. When costs rise, businesses often cut back a bit, much like how a higher ticket price might lead to a sparser crowd at an event.
Parametric Components (I-bar & b)
I-bar covers the investment spending that stays constant regardless of interest rate shifts. The coefficient b shows how quickly spending reacts to these changes. If b is larger, even a slight change in rates can lead to a noticeable difference in spending. Think of it like a sensitive dial, a small twist can lead to a big change.
| Axis/Param | Label | Definition |
|---|---|---|
| Y-Axis | r | Nominal interest rate (cost of funds) |
| X-Axis | I | Real investment spending |
| Parameter | b, I-bar | Rate sensitivity & autonomous investment |
Determinants Shaping the Investment Demand Graph

When companies feel good about future profits, they tend to invest more. Think of it like a small startup that suddenly grows after a strong sales report. A positive outlook makes borrowing easier and more attractive, which nudges the curve to the right.
New technology also matters a lot. When businesses spot new product ideas, better production methods, or simply a cool new tool, they are more likely to spend on capital. Imagine a company that starts using an innovative tool to boost its competitive edge. This fresh approach pushes the investment curve right as spending increases.
Government tax breaks and subsidies play their part too. When costs drop because of lower taxes or helpful financial incentives, companies find it easier to fund new projects. For example, a tax cut can create a ripple effect, leading businesses to expand their operations and move the demand curve outward.
On the other hand, if the economic mood turns gloomy or taxes go up, companies might hold back on spending. When confidence falls or costs rise, the curve shifts to the left. Plus, if people expect inflation to take off, the promise of future returns becomes less appealing, so businesses tighten their belts and delay investments.
Shifts in the Investment Demand Curve: Economic Scenarios

When prices start to rise fast, central banks usually raise interest rates to help cool things down. This makes loans more expensive, so companies often pull back on spending. Even a small rate increase can lead to a noticeable drop in investments, much like when higher grocery bills make households tighten their budgets. With more expensive borrowing, businesses become extra cautious before starting new projects.
In a recession, the outlook for future profits dims, so companies tend to delay or cut down on spending. The investment demand curve moves left because lower expected returns make firms more careful. Businesses choose to keep their budgets tight when confidence is low and loans become harder to get.
When governments use policies like tax cuts or boost spending on public projects, companies get a welcome push to invest more. These measures lower the overall cost of investing and can spark optimism about future earnings. In short, such fiscal moves shift the demand curve to the right, encouraging more investment even if interest rates hold steady.
On a similar note, when central banks ease monetary policy and cut interest rates, companies benefit from cheaper loans. Cheaper financing makes it easier to start new ventures, and that helps fuel a quick burst of investment spending. This effect ripples through the economy, boosting short-term projects and giving overall activity a fresh burst of energy.
Integrating the Investment Demand Graph into Aggregate Demand Analysis

Our new AD formula goes like this: AD = C + G + I-bar – br + NX. Here, I-bar is the investment spending that happens no matter what, while -br shows how investment changes when interest rates move. In other words, not every bit of investment is swayed by borrowing costs. Think of I-bar as the fixed spending that happens even if loans get pricey, and -b*r as the part that shifts when those costs change.
Now, picture this curve plotted against a 45° line, which marks where total demand meets the country’s output. The y-intercept of that line, calculated as C + G + I-bar + NX, shows what the national income would be if interest rates had no effect at all. It’s a clear reminder that the steady spending and net exports form the backbone of aggregate demand, while the interest-sensitive part adjusts on top of that solid base.
When interest rates change, you can actually see the AD curve shift. For instance, if interest rates drop, borrowing becomes cheaper and spending can increase. This lifts the AD curve upwards along that 45° line, landing at a higher equilibrium national income. It’s like an extra boost for the economy when loans get less expensive.
Comparing Investment Demand Graph with Loanable Funds & Money Market Diagrams

The investment demand graph is like a picture that shows how much companies spend on new projects based on the cost of borrowing money. When interest rates go down, companies often invest more because loans get cheaper. It gives a clear view of how borrowing costs affect spending decisions in the economy.
Next up, the loanable funds model brings together the money people save and the money companies need to borrow. Imagine it as a meeting point where the amount of money savers put aside and the funds borrowers need come together to set a common interest rate. This model shows how household savings and business investments mix to create the rates you see in the market.
Then we have the money market diagram that zooms in on how much money is in the system and what people prefer for holding cash. Here, the bank’s choices and central bank policies play a big role. When the central bank tweaks the money supply, it changes the cost of borrowing. This view helps explain how changes in money supply can ripple out to influence overall financial conditions and investment opportunities.
Each model offers its own insights. The investment demand graph shows the direct impact of lower borrow costs on spending, the loanable funds model highlights how saving and borrowing balance out, and the money market diagram focuses on the role of central banks in keeping rates steady. Together, they help us understand the circle of saving, borrowing, and liquidity in our economy.
Advanced Curve Mechanics: Slope Sensitivity & Policy Effects
When the interest sensitivity parameter, b, goes up, the investment demand curve tends to flatten. Even a tiny tweak in the interest rate can spark a big change in investment spending. It’s surprising but true, a small drop in rates might unleash a major jump in capital outlays, showing just how tuned in businesses are to borrowing costs.
Higher tax rates quickly cut into net I-bar and reduce b’s impact, which makes the curve noticeably steeper. Picture financial conditions tightening quickly, forcing companies to be extra careful with their investments.
Investment habits shift with changes in risk tolerance during different business cycles. When confidence is high, firms might dive into extra projects, even if interest rates creep up. Think of it like turning a very sensitive dial, a tiny twist can lead to a big swing in spending, much like how a small change in consumer spending can change demand curves drastically.
Fiscal measures such as raised tax rates not only shrink the basic level of investment but also make the curve more sensitive. In short, when tax pressures pile up, the investment demand curve gets steeper, which can shift capital allocation trends over time.
Final Words
in the action, we broke down how the investment demand graph helps visualize the link between interest rates and capital spending. We unpacked the axes, the I = I-bar – b·r formula, and how shifts in market factors influence the curve.
This clear view makes complex ideas more approachable. By connecting key variables and real economic triggers, smart digital finance decisions become easier, paving the way for confident, secure investments and long-term financial growth.
FAQ
What is the investment demand graph and what does it show?
The investment demand graph explains how lower interest rates reduce borrowing costs, which boosts investment spending. It plots the nominal interest rate on the vertical axis against investment spending on the horizontal axis.
What is the investment demand graph formula and how does it work?
The investment demand graph uses the formula I = Ī – b·r. Ī represents autonomous spending and b shows how sensitive investment is to changes in interest rates, directly affecting the curve’s slope.
How is the investment demand graph used in AP macro and macroeconomics?
The investment demand graph applies in AP macro by showing shifts in business confidence, technology, and policy influences. It connects with macroeconomics by explaining how interest rate changes adjust overall investment spending.
How does the investment demand graph relate to an inflationary gap?
The investment demand graph reflects an inflationary gap by illustrating how rising inflation may prompt central banks to increase interest rates, which in turn reduces investment spending and shifts the curve leftward.
What factors shift the investment demand curve?
The investment demand curve shifts due to changes in expected returns, business confidence, government incentives, technological innovation, and fiscal policies. Favorable conditions shift it right, while adverse ones shift it left.
What differentiates the investment curve from the investment demand curve?
The investment curve generally shows investment spending at given rates, while the investment demand curve highlights changes in spending as interest rates vary. The latter incorporates sensitivity to rate changes via the coefficient b.
What are the five key factors of the demand curve in this context?
The five core factors include: the interest rate, investment spending levels, the downward slope rationale, the role of autonomous spending (Ī) and sensitivity coefficient (b), plus policy and economic triggers causing shifts.
How can I graph a demand curve for investment?
To graph a demand curve, plot investment spending on the horizontal axis and the interest rate on the vertical axis, use the formula I = Ī – b·r to calculate key points, and draw a downward-sloping line reflecting lower rates boosting investment spending.
Where can I access an investment demand graph PDF?
Many educational and financial websites offer investment demand graph PDFs. A quick search with your preferred terms usually leads to resources in academic journals or trusted financial portals.